Dashboard
The homepage of the Qwiet Dashboard is the Dashboard view. This page provides an overview of results generated by Qwiet AI by Harness, as well as important metrics for the organization.
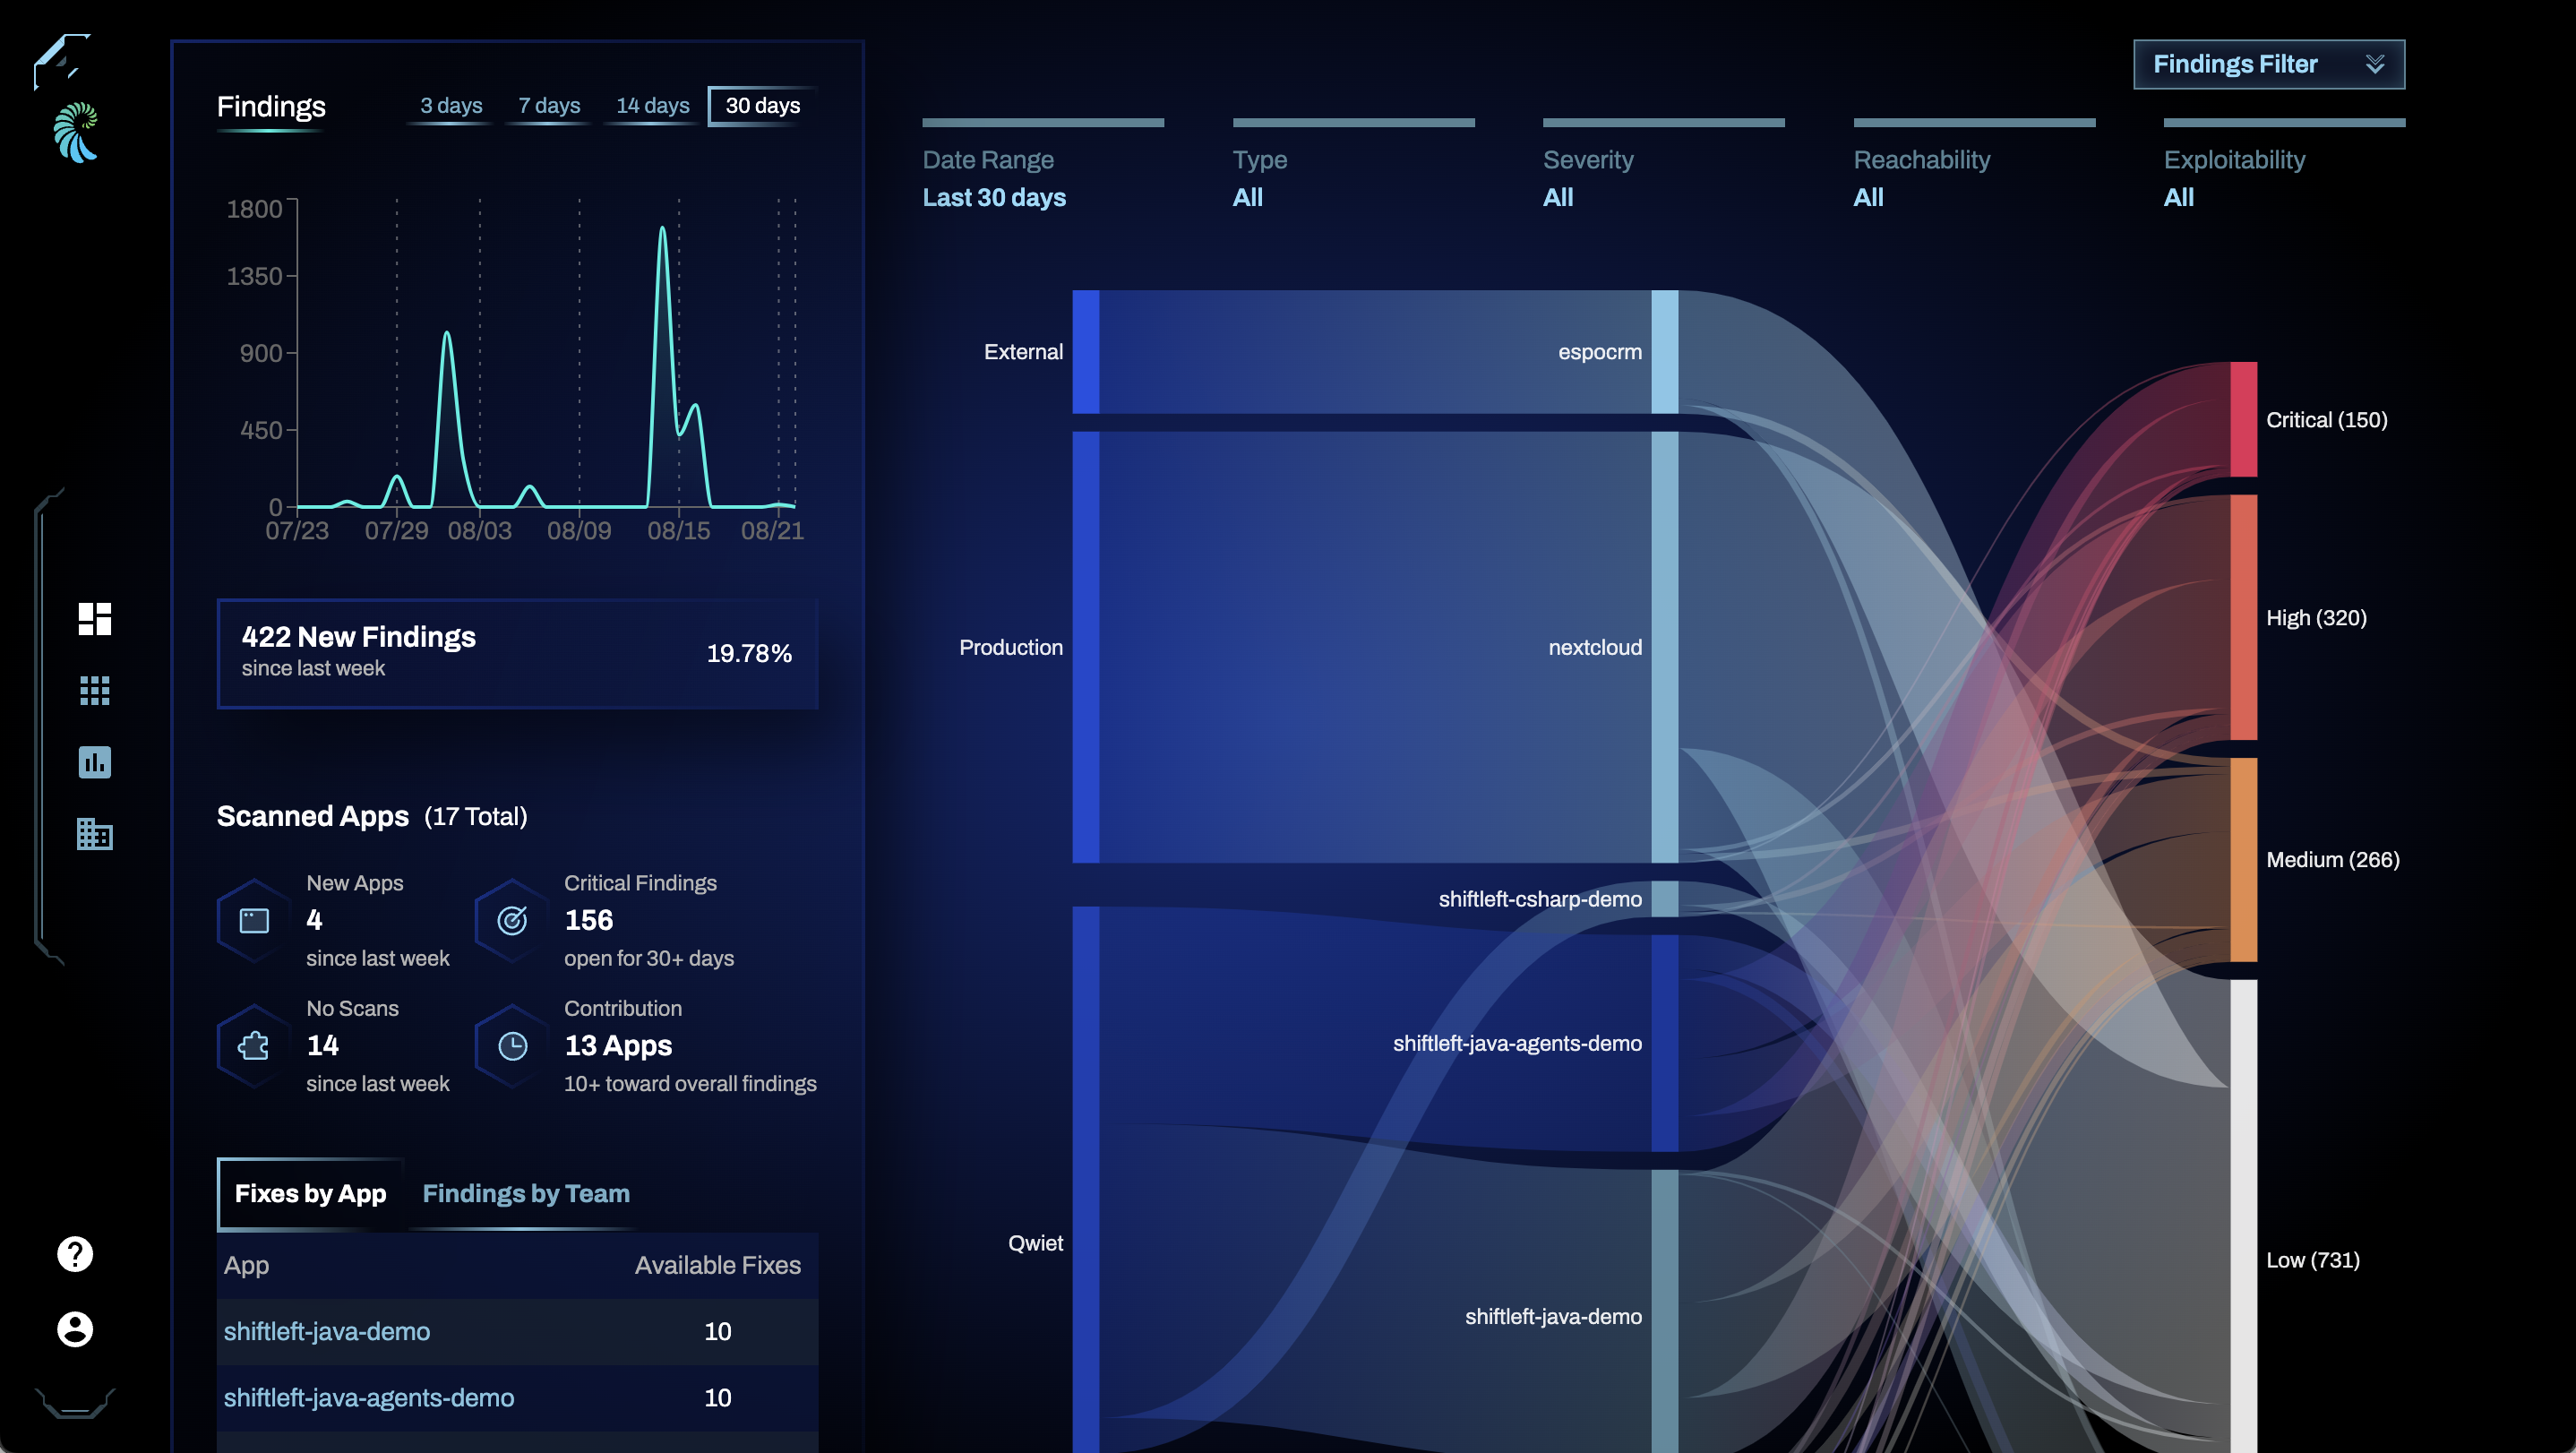
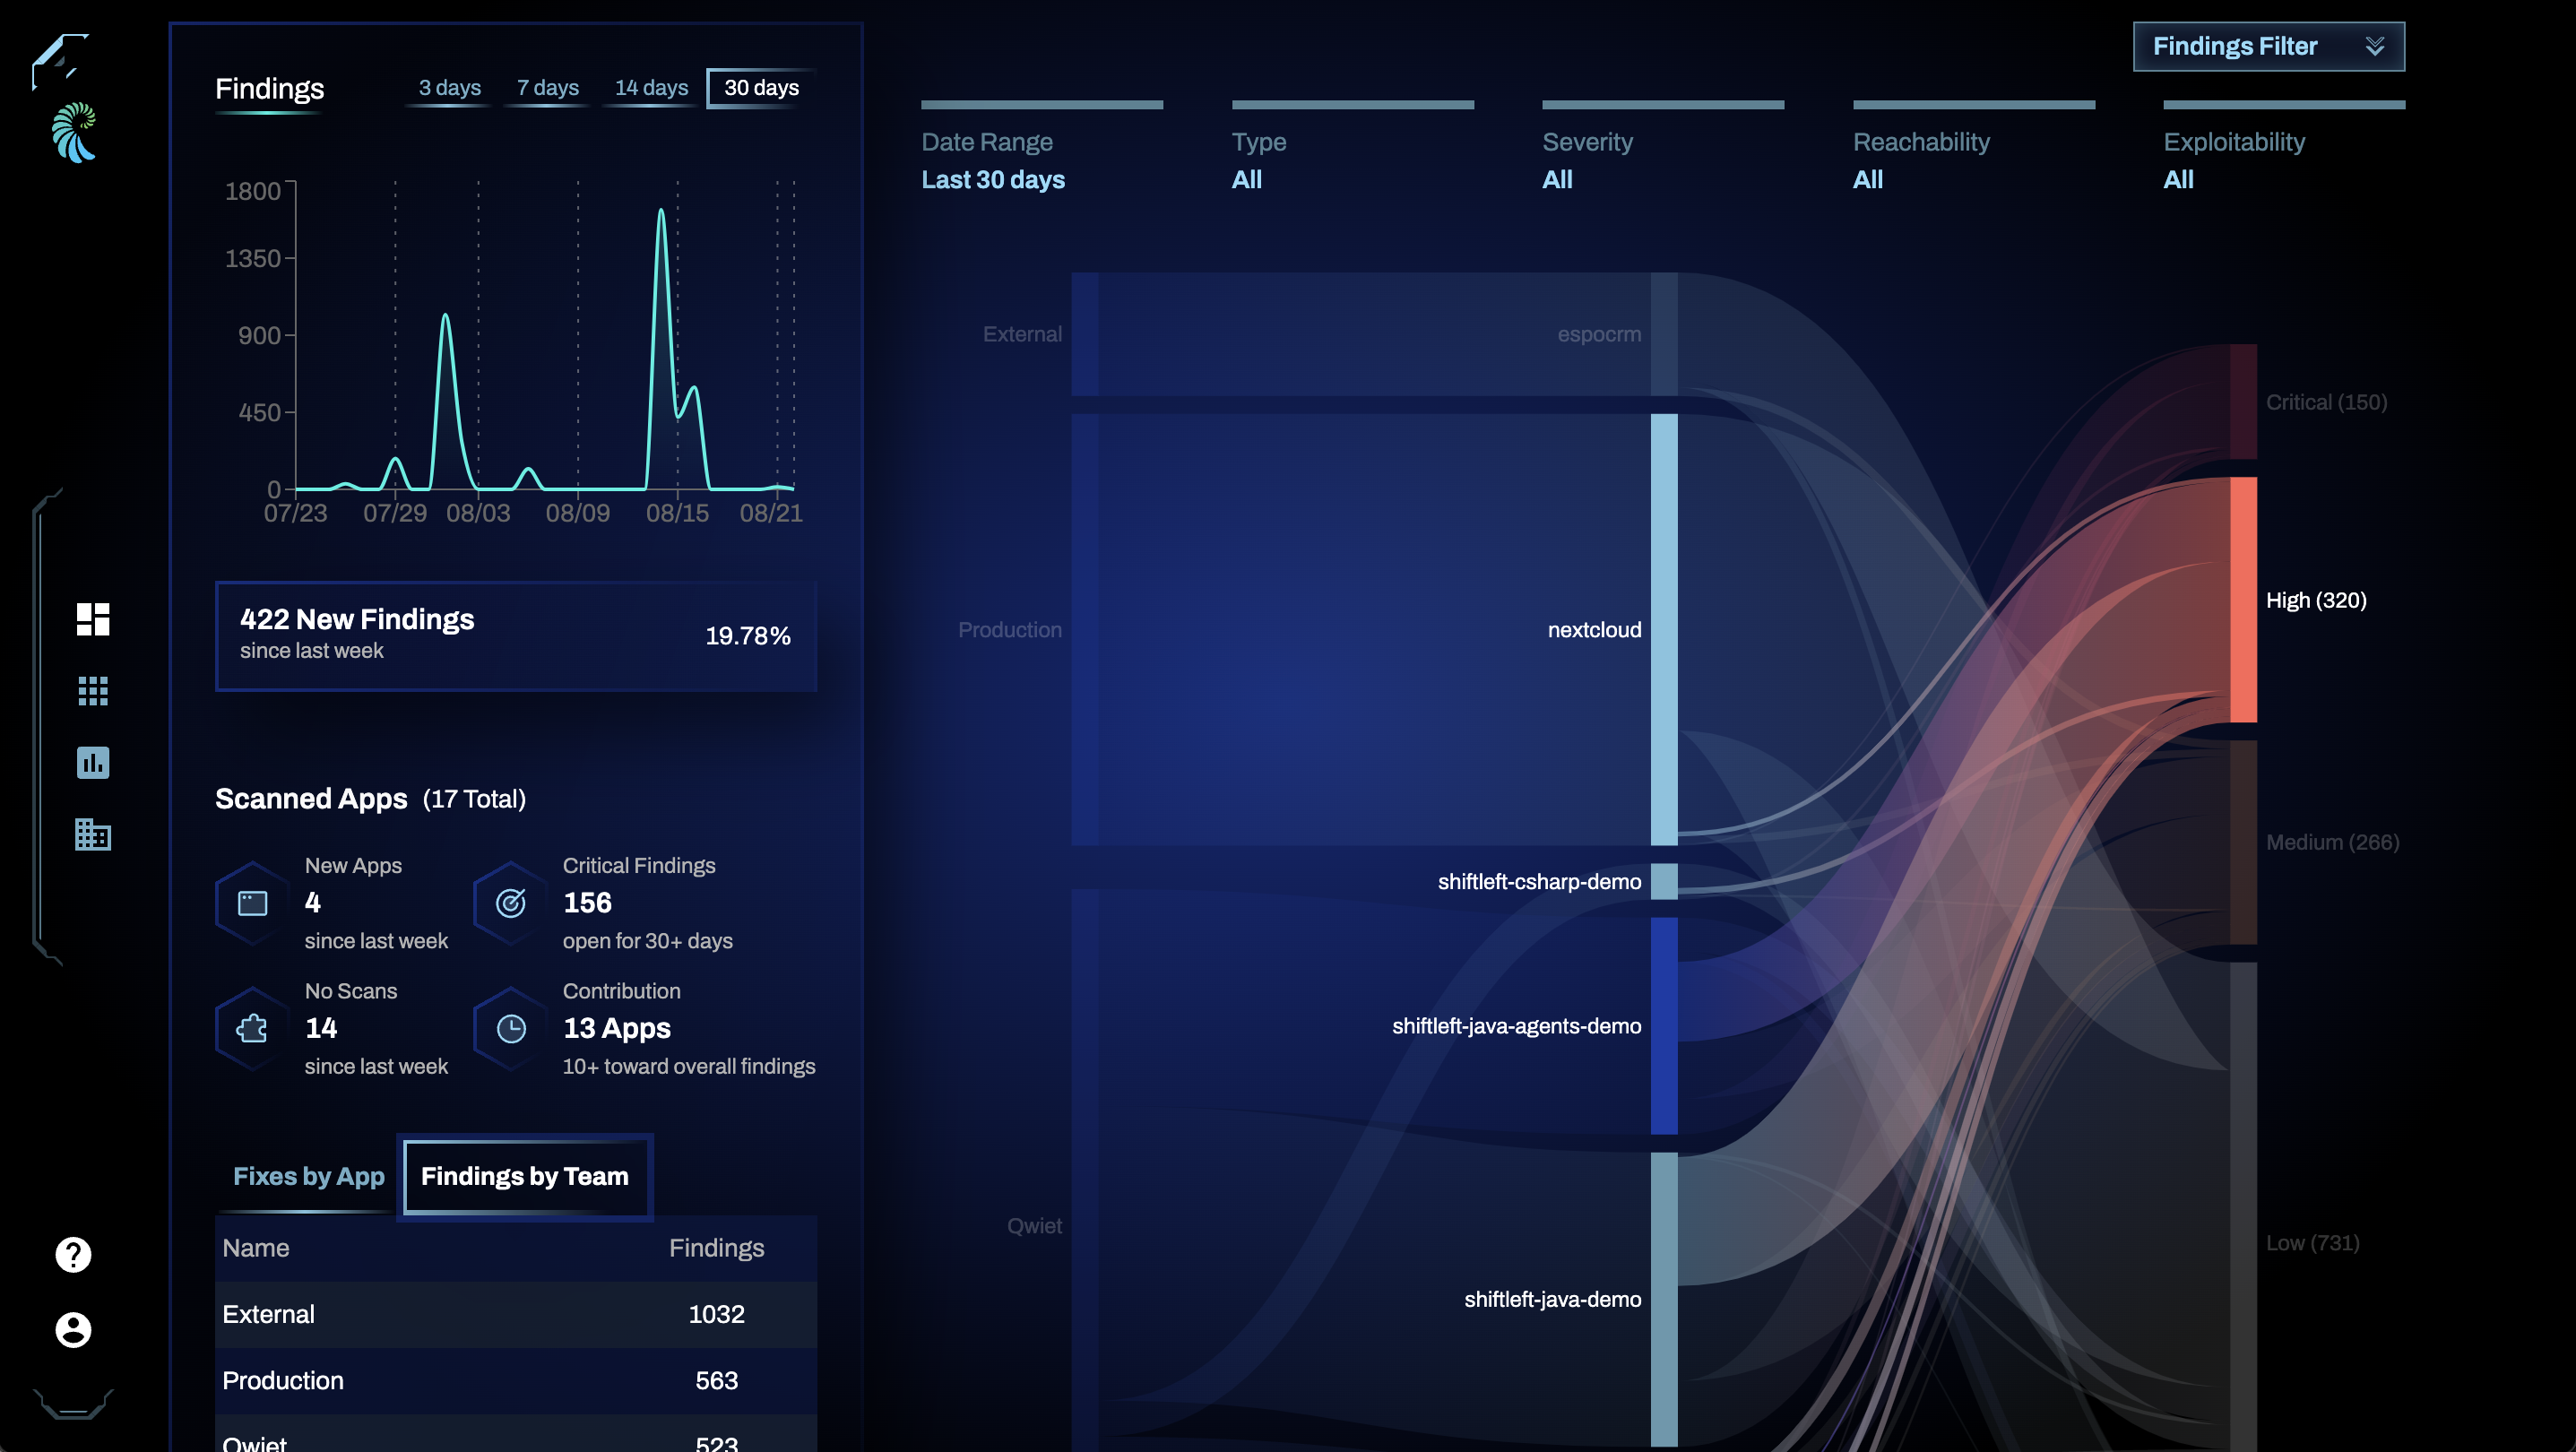
Sankey chart
At the center of the page you'll see a sankey chart that shows findings by teams, applications, and severity.
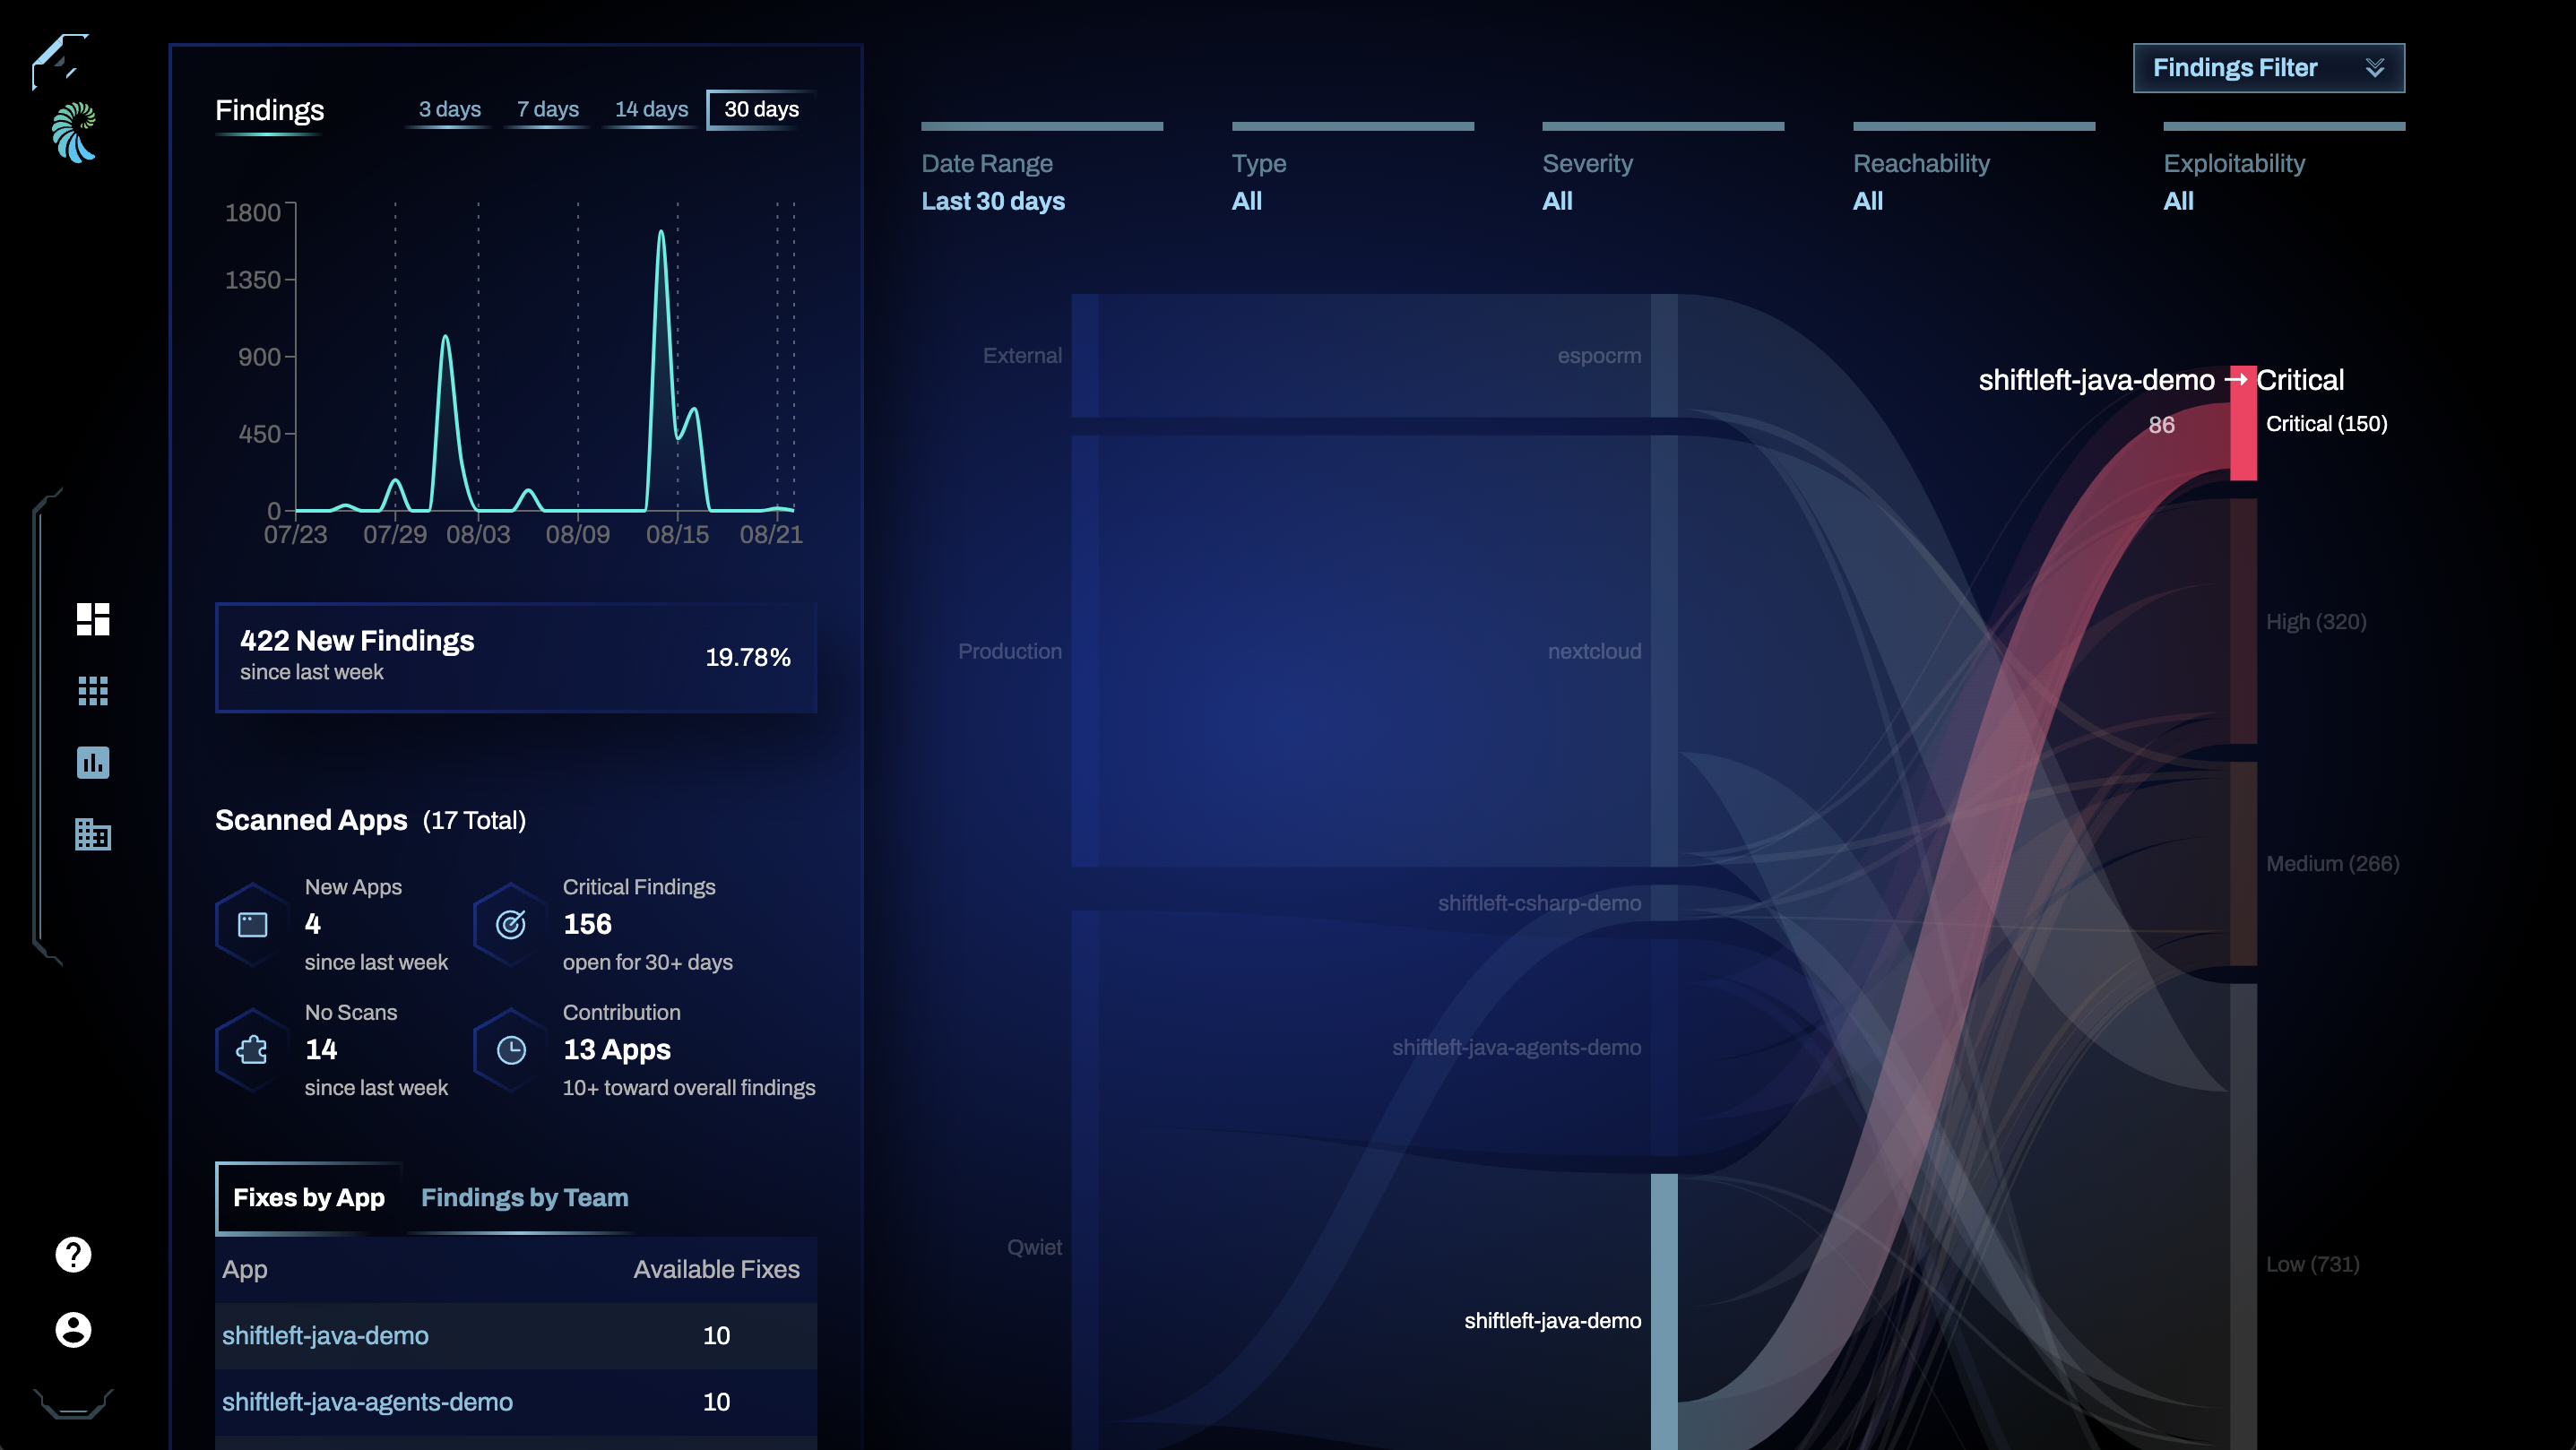
You can hover over the different elements in the chart to see findings counts between nodes.
Clicking on the Teams, Apps, or Severity nodes (darker and highlighted vertical bars) to go to a filtered view of the findings in the Findings tab of the Reporting section.
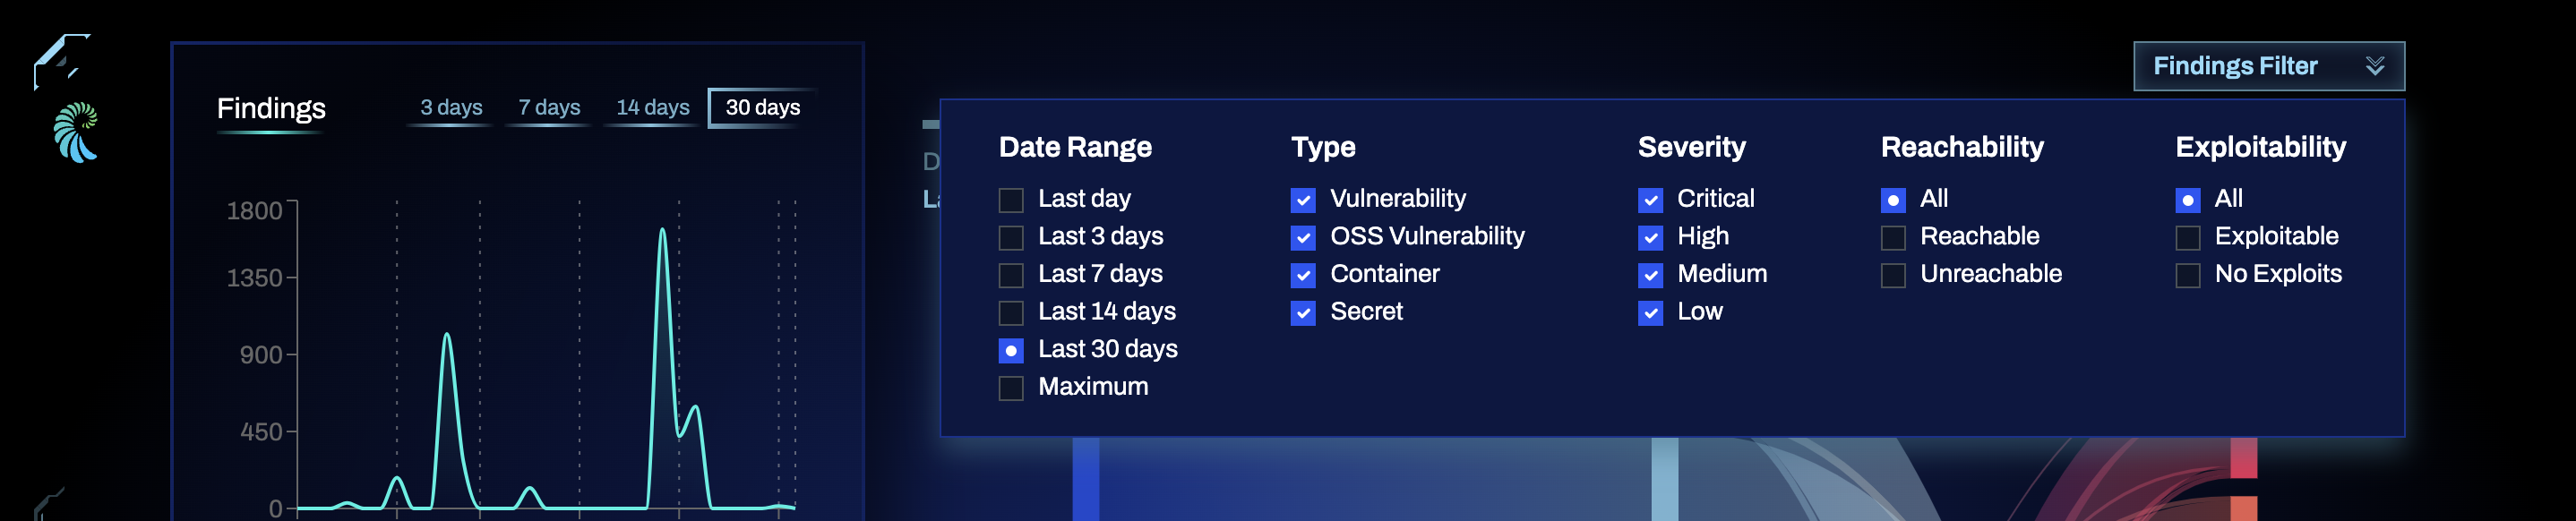
Use the Findings Filter section above the sankey to select filters and a different time range.
Left-hand side panel
The left-hand side section of the dashboard shows key metrics for your organization, such as findings over time, the number of new findings in the last week, information about scanned applications, and a breakdown of the number of AutoFix suggestions available (if enabled for the organization) as well as the number of findings by team. Let's look at them in more detail:
- Findings: on the left top corner of the page you'll see a chart that shows findings over time. You can select the time period: 3, 7, 14, and 30 days
- New findings: just below the findings over time panel you will see the number of new findings in the last week and the increased or decreased percentage with respect to the previous week
- Scanned Apps: the Scanned Apps panel shows information about scanned applications, such as the number of new applications since last week, the number of critical findings that remain open for 30 days or longer, the number of scans performed since last week, and the number of scanned applications that are contributing 10 or more findings to the overall findings count
- Fixes by App / Findings by Team: