Reporting
The Reporting section allows you to view, report, and export findings and trends for specific applications or all the applications in the organization, for a specific period of time.
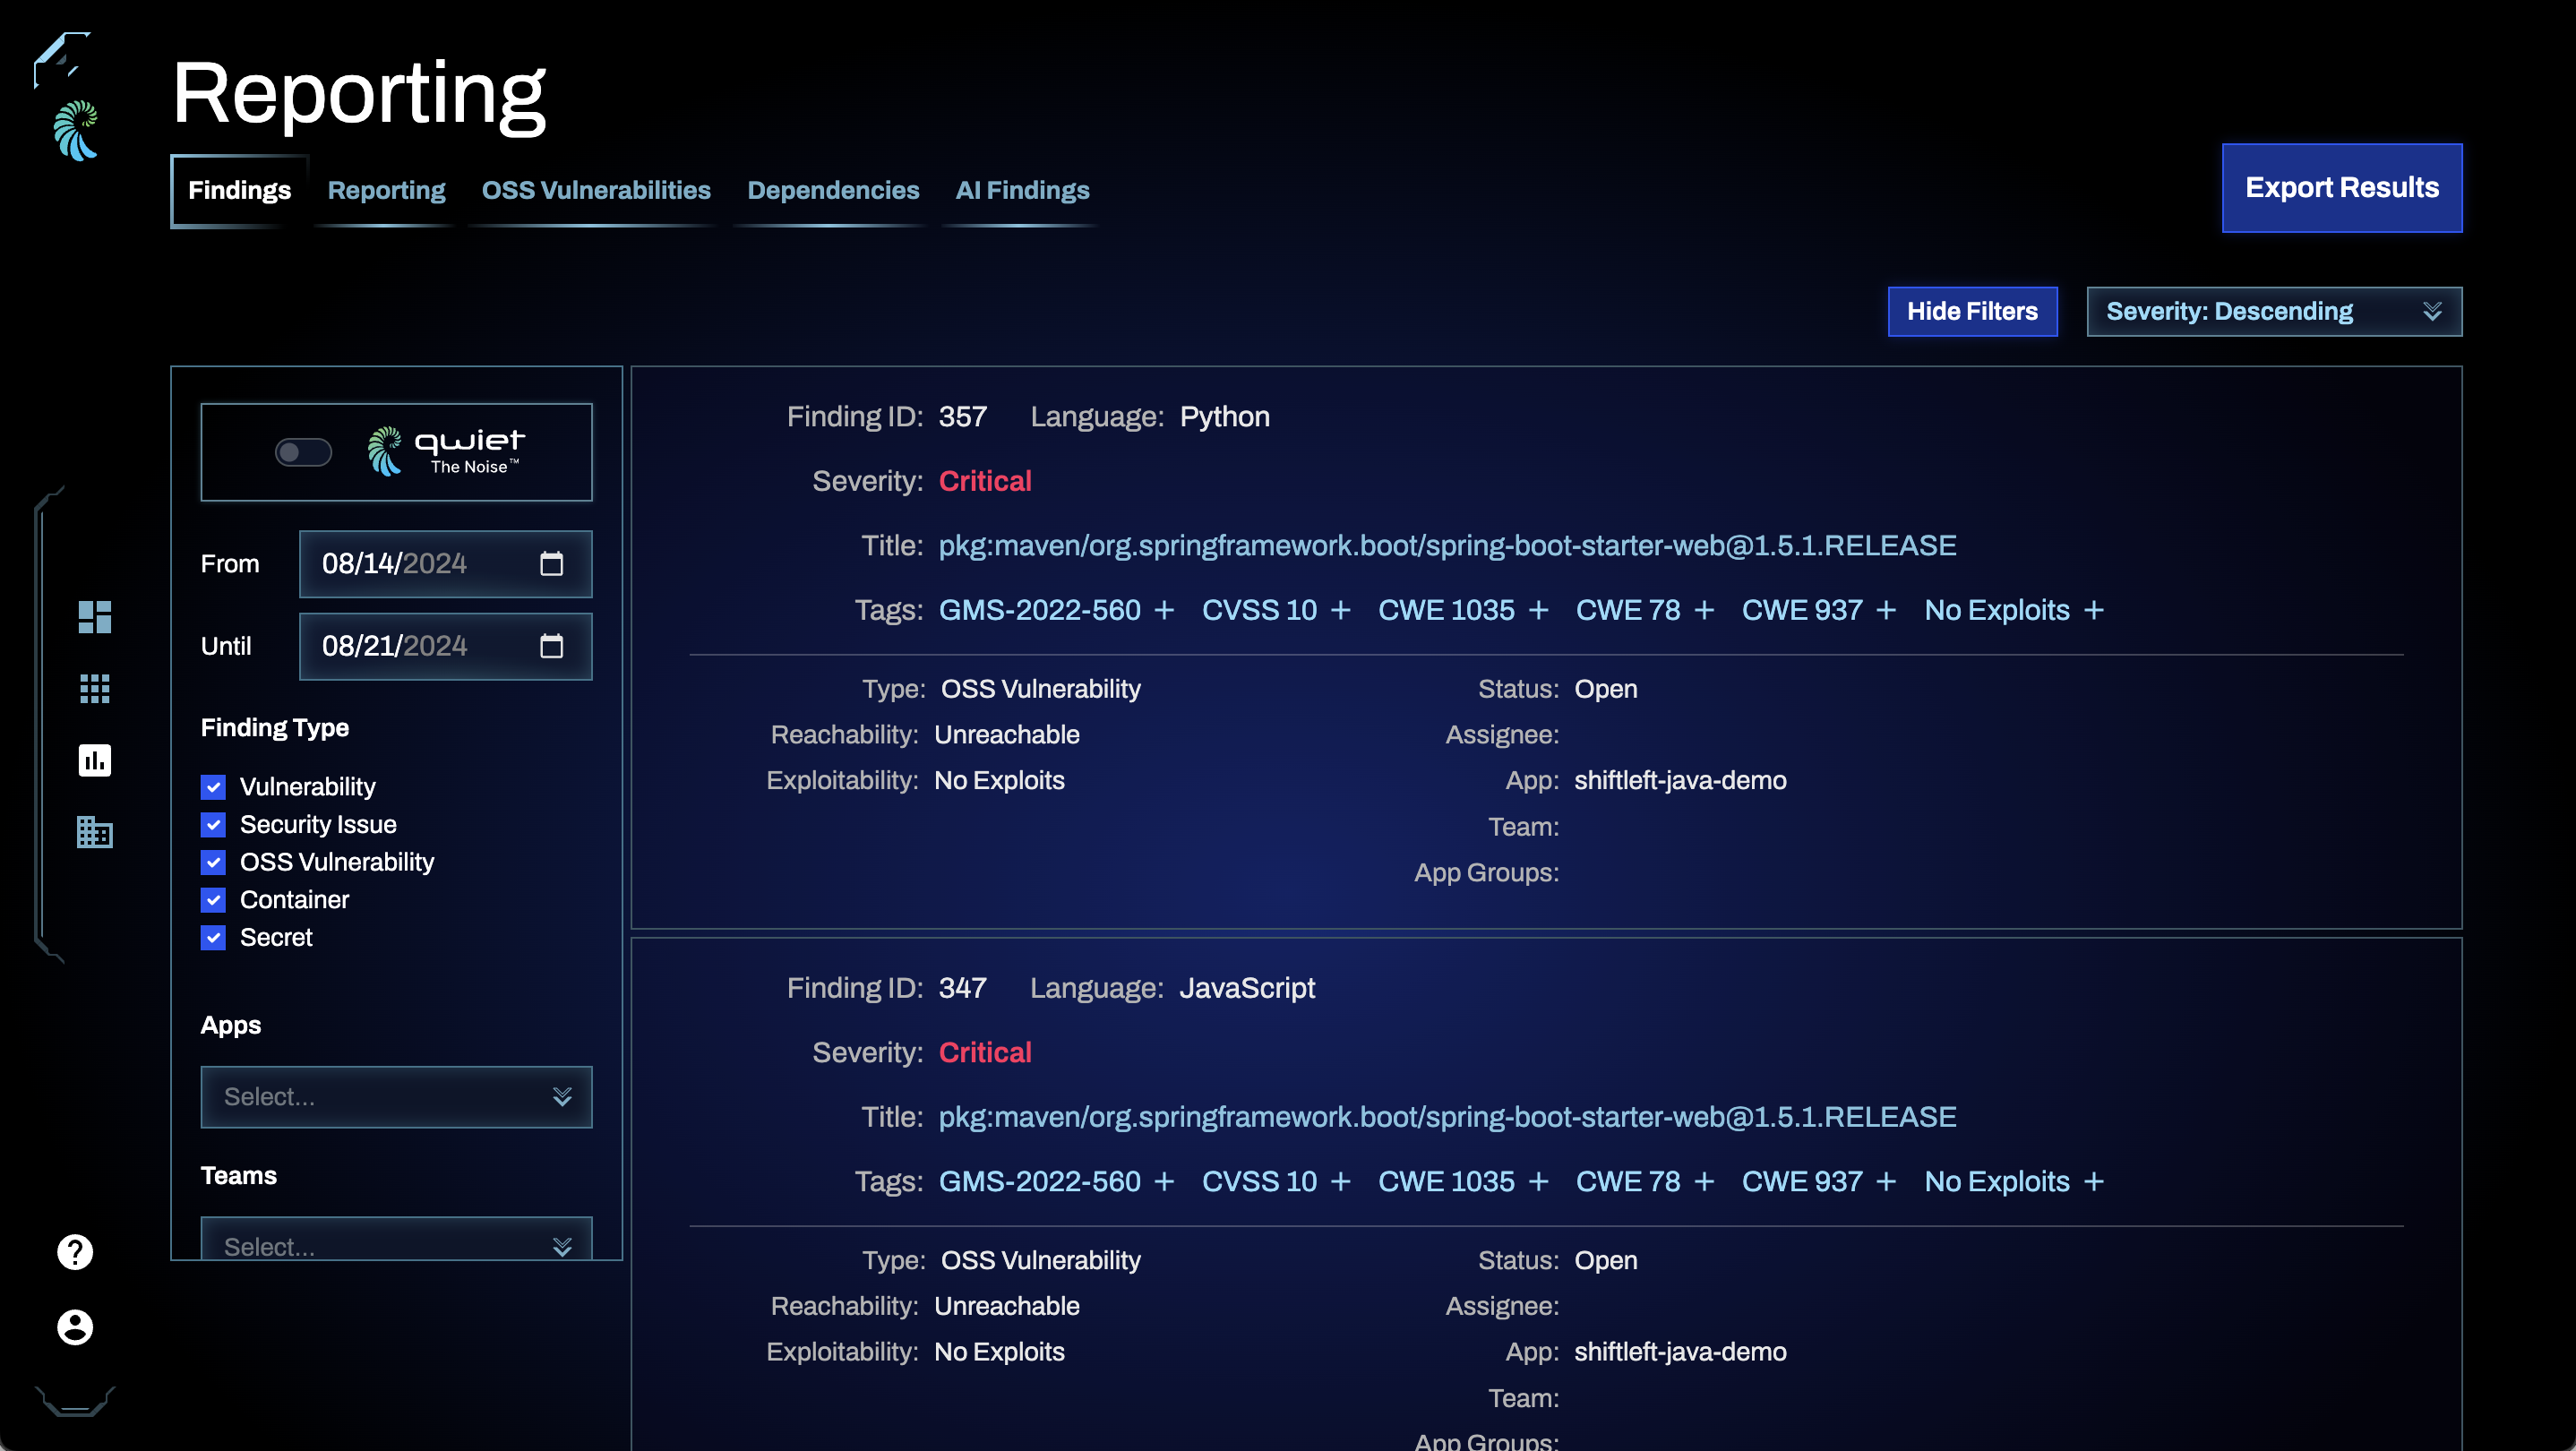
Findings
The Findings tab, also known as Organization Findings, allows you to view findings for all applications and languages in the organization, for the selected time period.
Choosing a time period
The Findings tab shows results for all applications in the organization from the last 7 days by default. The Dashboard also uses this default setting. To view findings for a different time period (up to 90 days), use the date picker or enter dates in the From and Until fields.
Filtering findings
You can filter the findings displayed by:
- Finding Type
- Apps
- Teams
- App Groups
- Language
- Severity
- Status
- Assigned To
- AutoFix
- Exploitability
- Reachability
- CVSS Score
- EPSS Score
- Package Group
- Package Component
- OWASP 2021 Category
- OWASP Category
- CWE Category
- CVE
- Category
Exporting Results
You can generate a CSV file export that includes all the findings according to the different filters that have been applied. To do so, click on the Export Results button on the top right-hand side of the page and select or unselect columns you'd like included in the CSV export. The download will begin immediately.
Reporting
The Reporting tab allows you to create and export reports featuring your applications' findings.
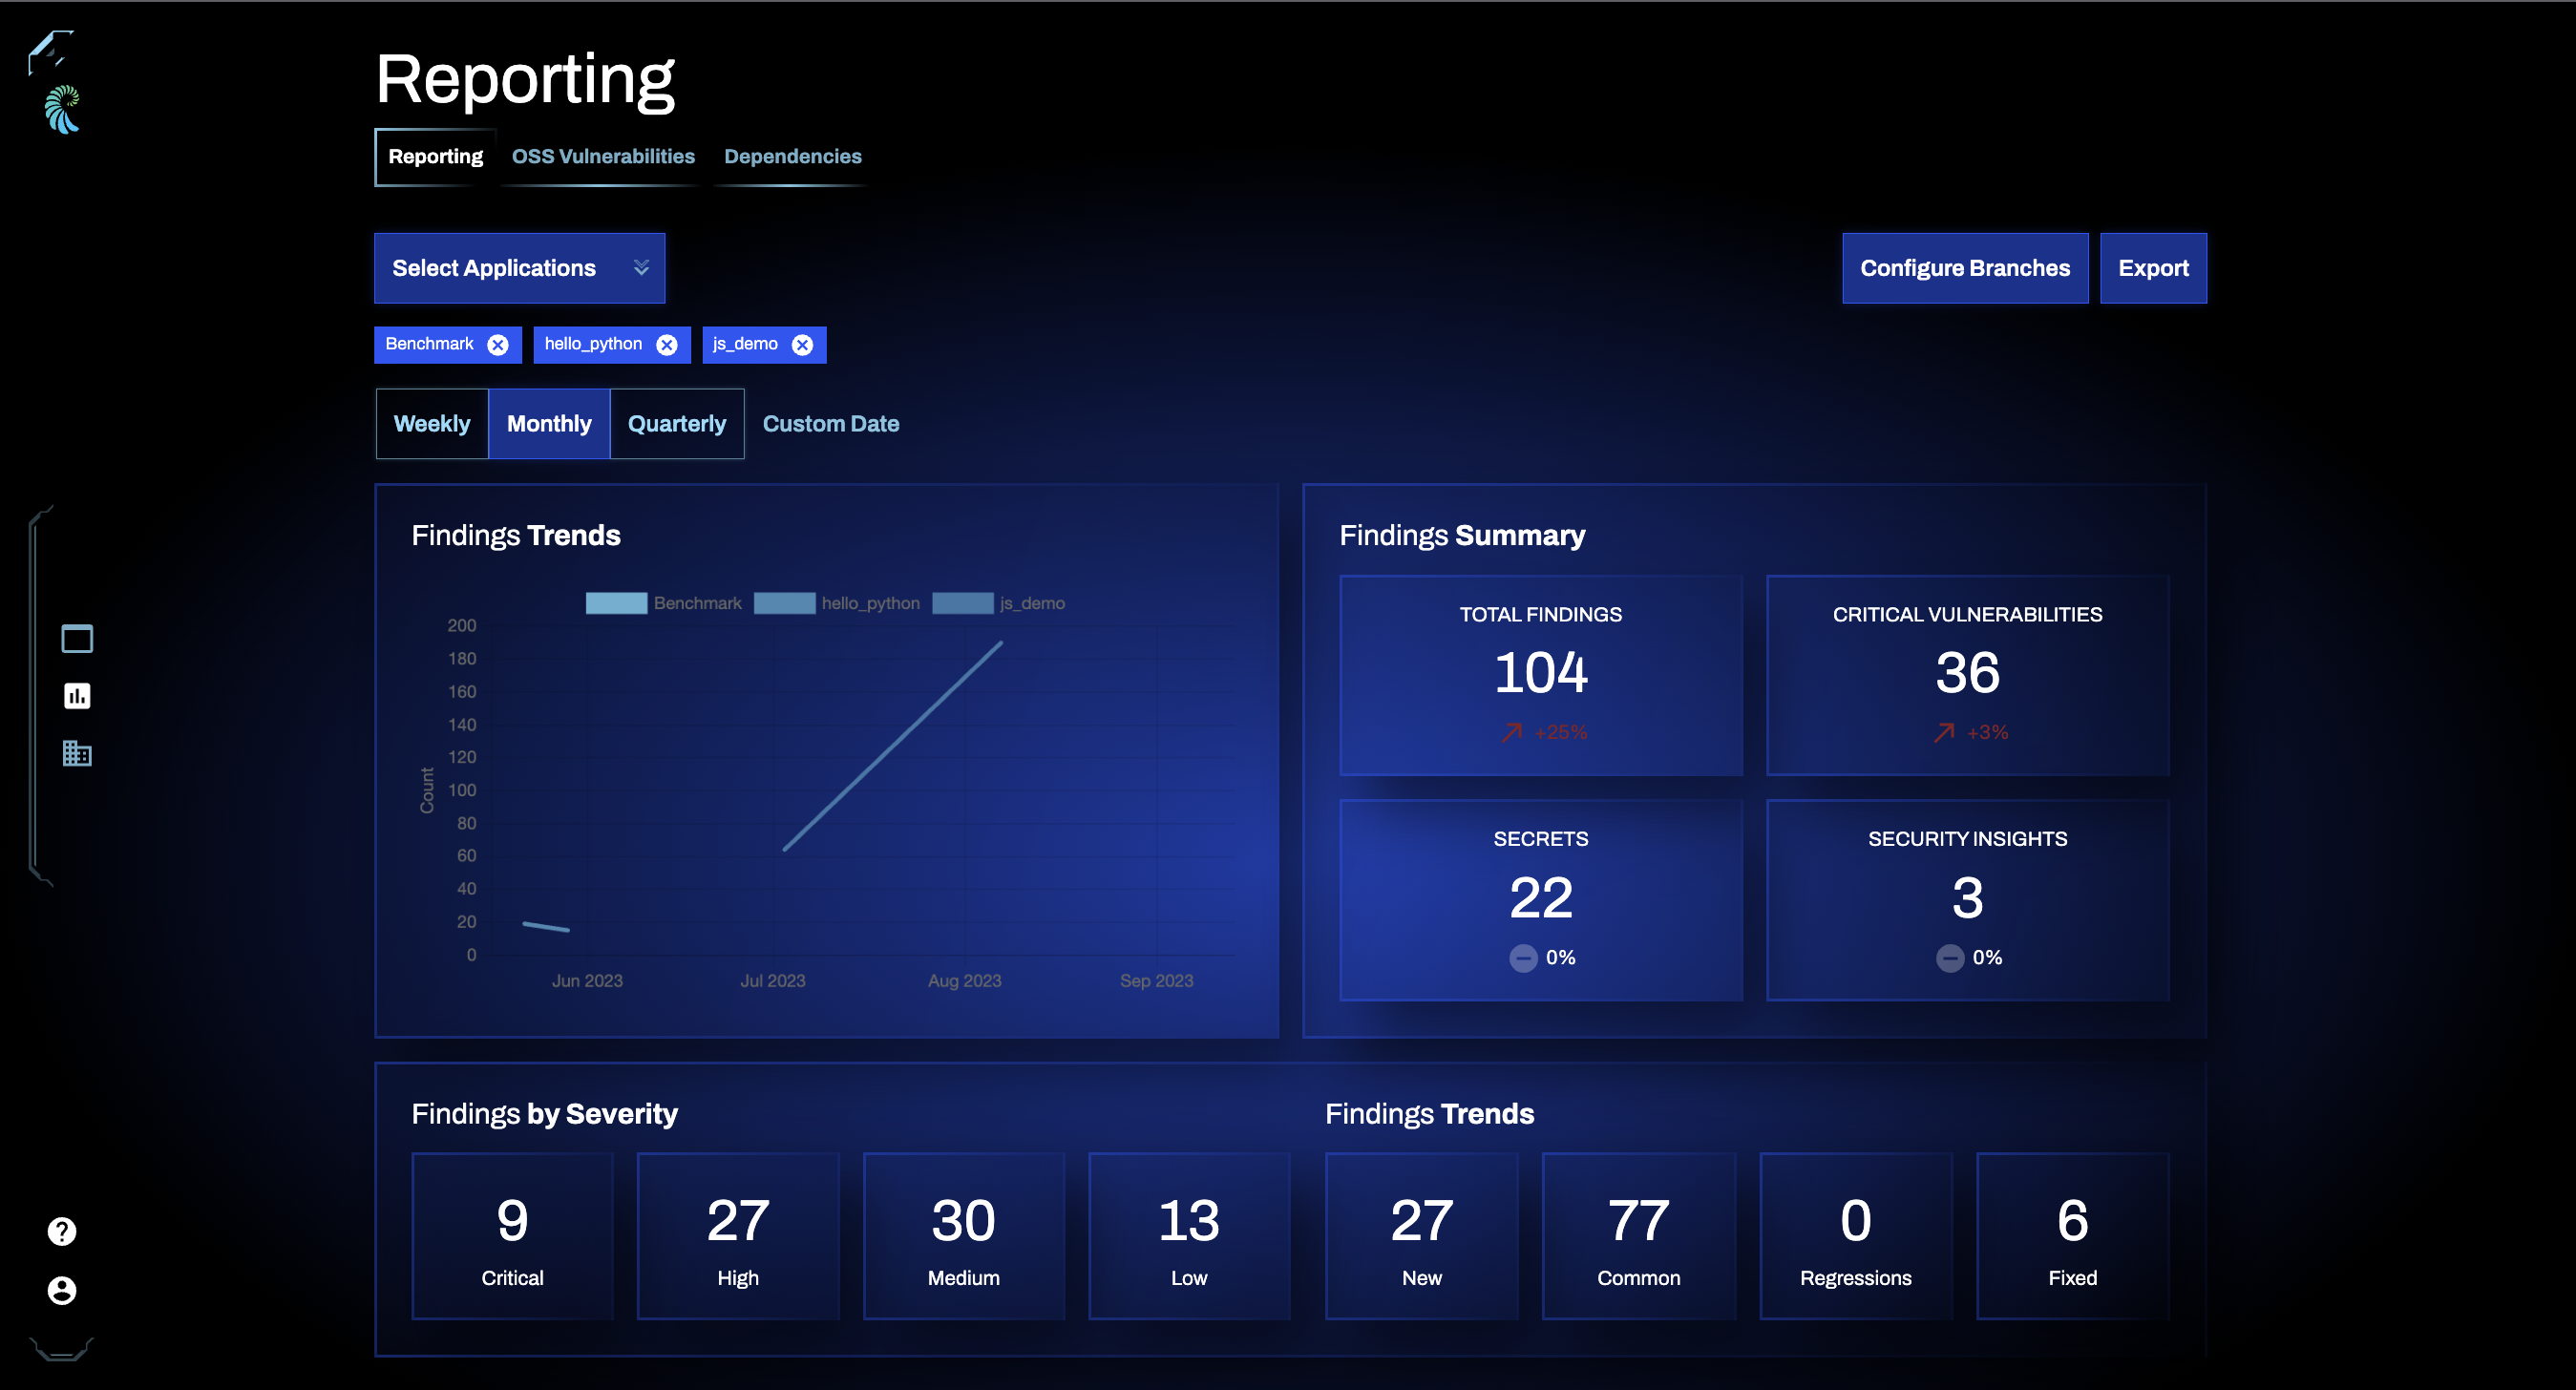
You can display information for just one of your applications or multiple applications simultaneously. To do so, click Select Applications and check the applications you want included in your report.
Setting the reporting dates
You can set the time frame for which you see data:
- Choosing Weekly will display findings for the past four weeks
- Choosing Monthly will display findings for the past twelve months
- Choosing Quarterly will display findings for the past four quarters
- Choose Custom Date will allow you to specify the date range in which you're interested
As you change your dates, you'll see the values for the data displayed change.
To switch from a custom date filter back to a default date filter, click Clear Custom Date
Reporting data
The reporting page displays:
- A Findings Trends graph, which shows how the number of findings for your applications changes over time;
- Findings Summary, which shows the total number of findings, critical vulnerabilities, secrets, and security insights present in your applications, along with the percentage change in each of these measures during your selected time frame;
- Findings by Severity, which shows the number of findings by severity
- Findings Trends, which shows the number of new findings, common findings, and regressions and the number of findings fixed over time.
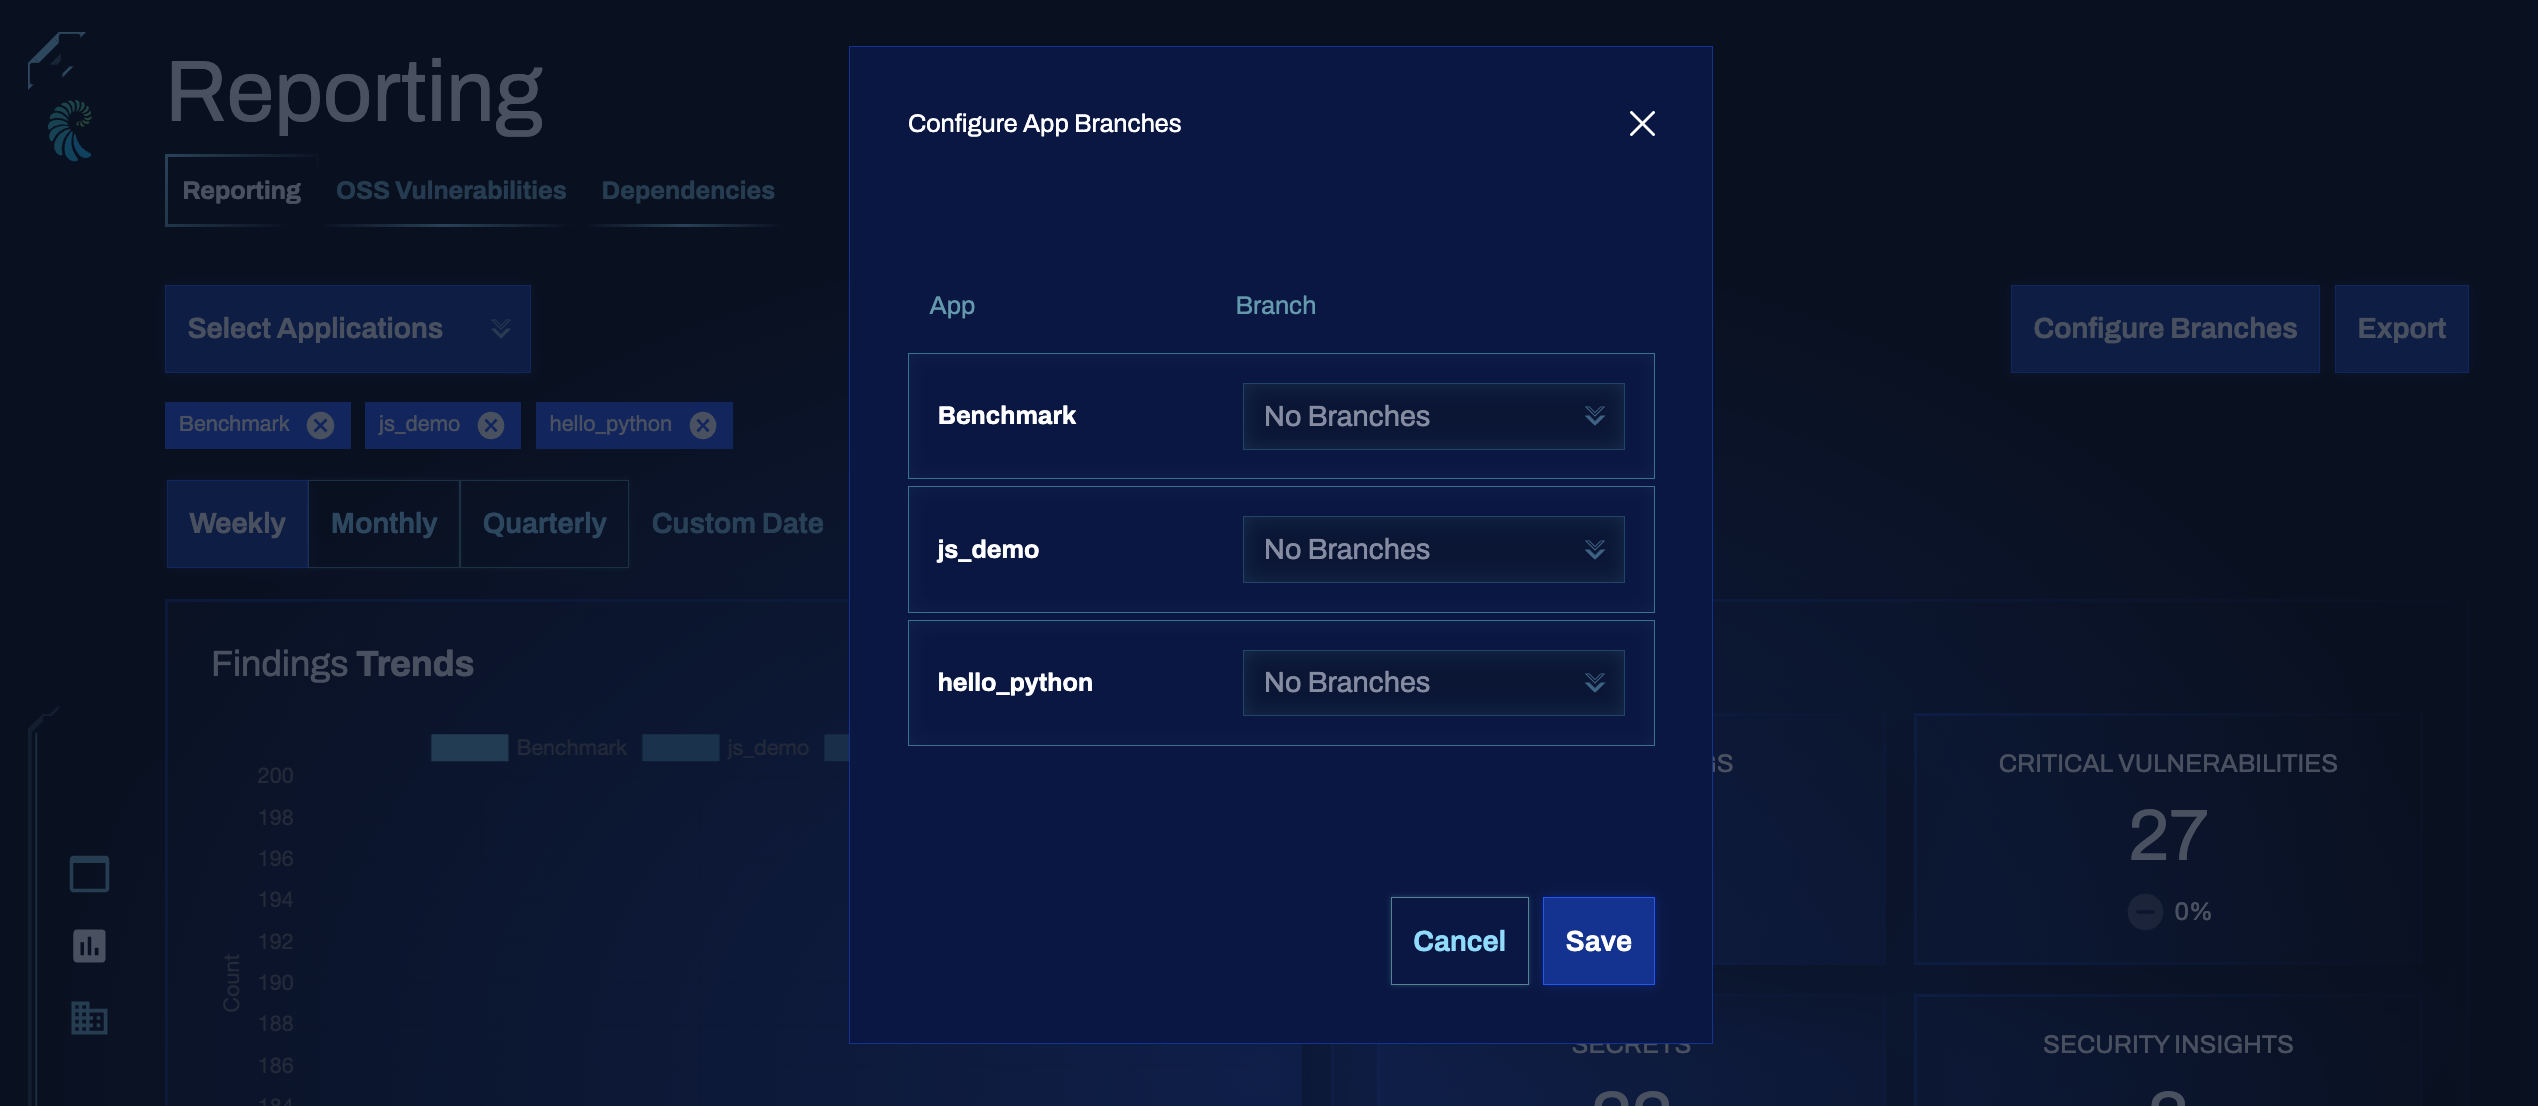
Configure App Branches
You can include only specific branches rather than all the data for a given application. For example, let's say that your report includes information for App A and App B. However, you can customize the report to include information for all branches scanned for App A. For App B, you could include only two branches: fix-1 and fix-2.
Export report
To export a copy of your data, click Export. You can choose to Export as PDF or to Export as HTML.
If you do not want to export all of your data, flip the Custom toggle to select the specific details you want to include in the report. Then, choose Export as PDF or Export as HTML.
Reporting on OSS vulnerabilities
The reporting section features an OSS Vulnerabilities tab, which allows you to create and export data on vulnerabilities introduced to your applications via OSS libraries and packages.
Selecting applications
You can display information for just one of your applications or multiple applications simultaneously. To do so, click Select Applications and check the applications you want included in your report.
Setting the reporting dates
You can set the time frame for which you see data:
- Choosing Weekly will display findings for the past four weeks
- Choosing Monthly will display findings for the past twelve months
- Choosing Quarterly will display findings for the past four quarters
- Choose Custom Date will allow you to specify the date range in which you're interested
As you change your dates, you'll see the values for the data displayed change.
To switch from a custom date filter back to a default date filter, click Clear Custom Date
Viewing data
The OSS Vulnerability Trends chart shows how the number of OSS vulnerabilities has changed over the date range you selected. The top reachable issues in your selected applications are to the right of the graph.
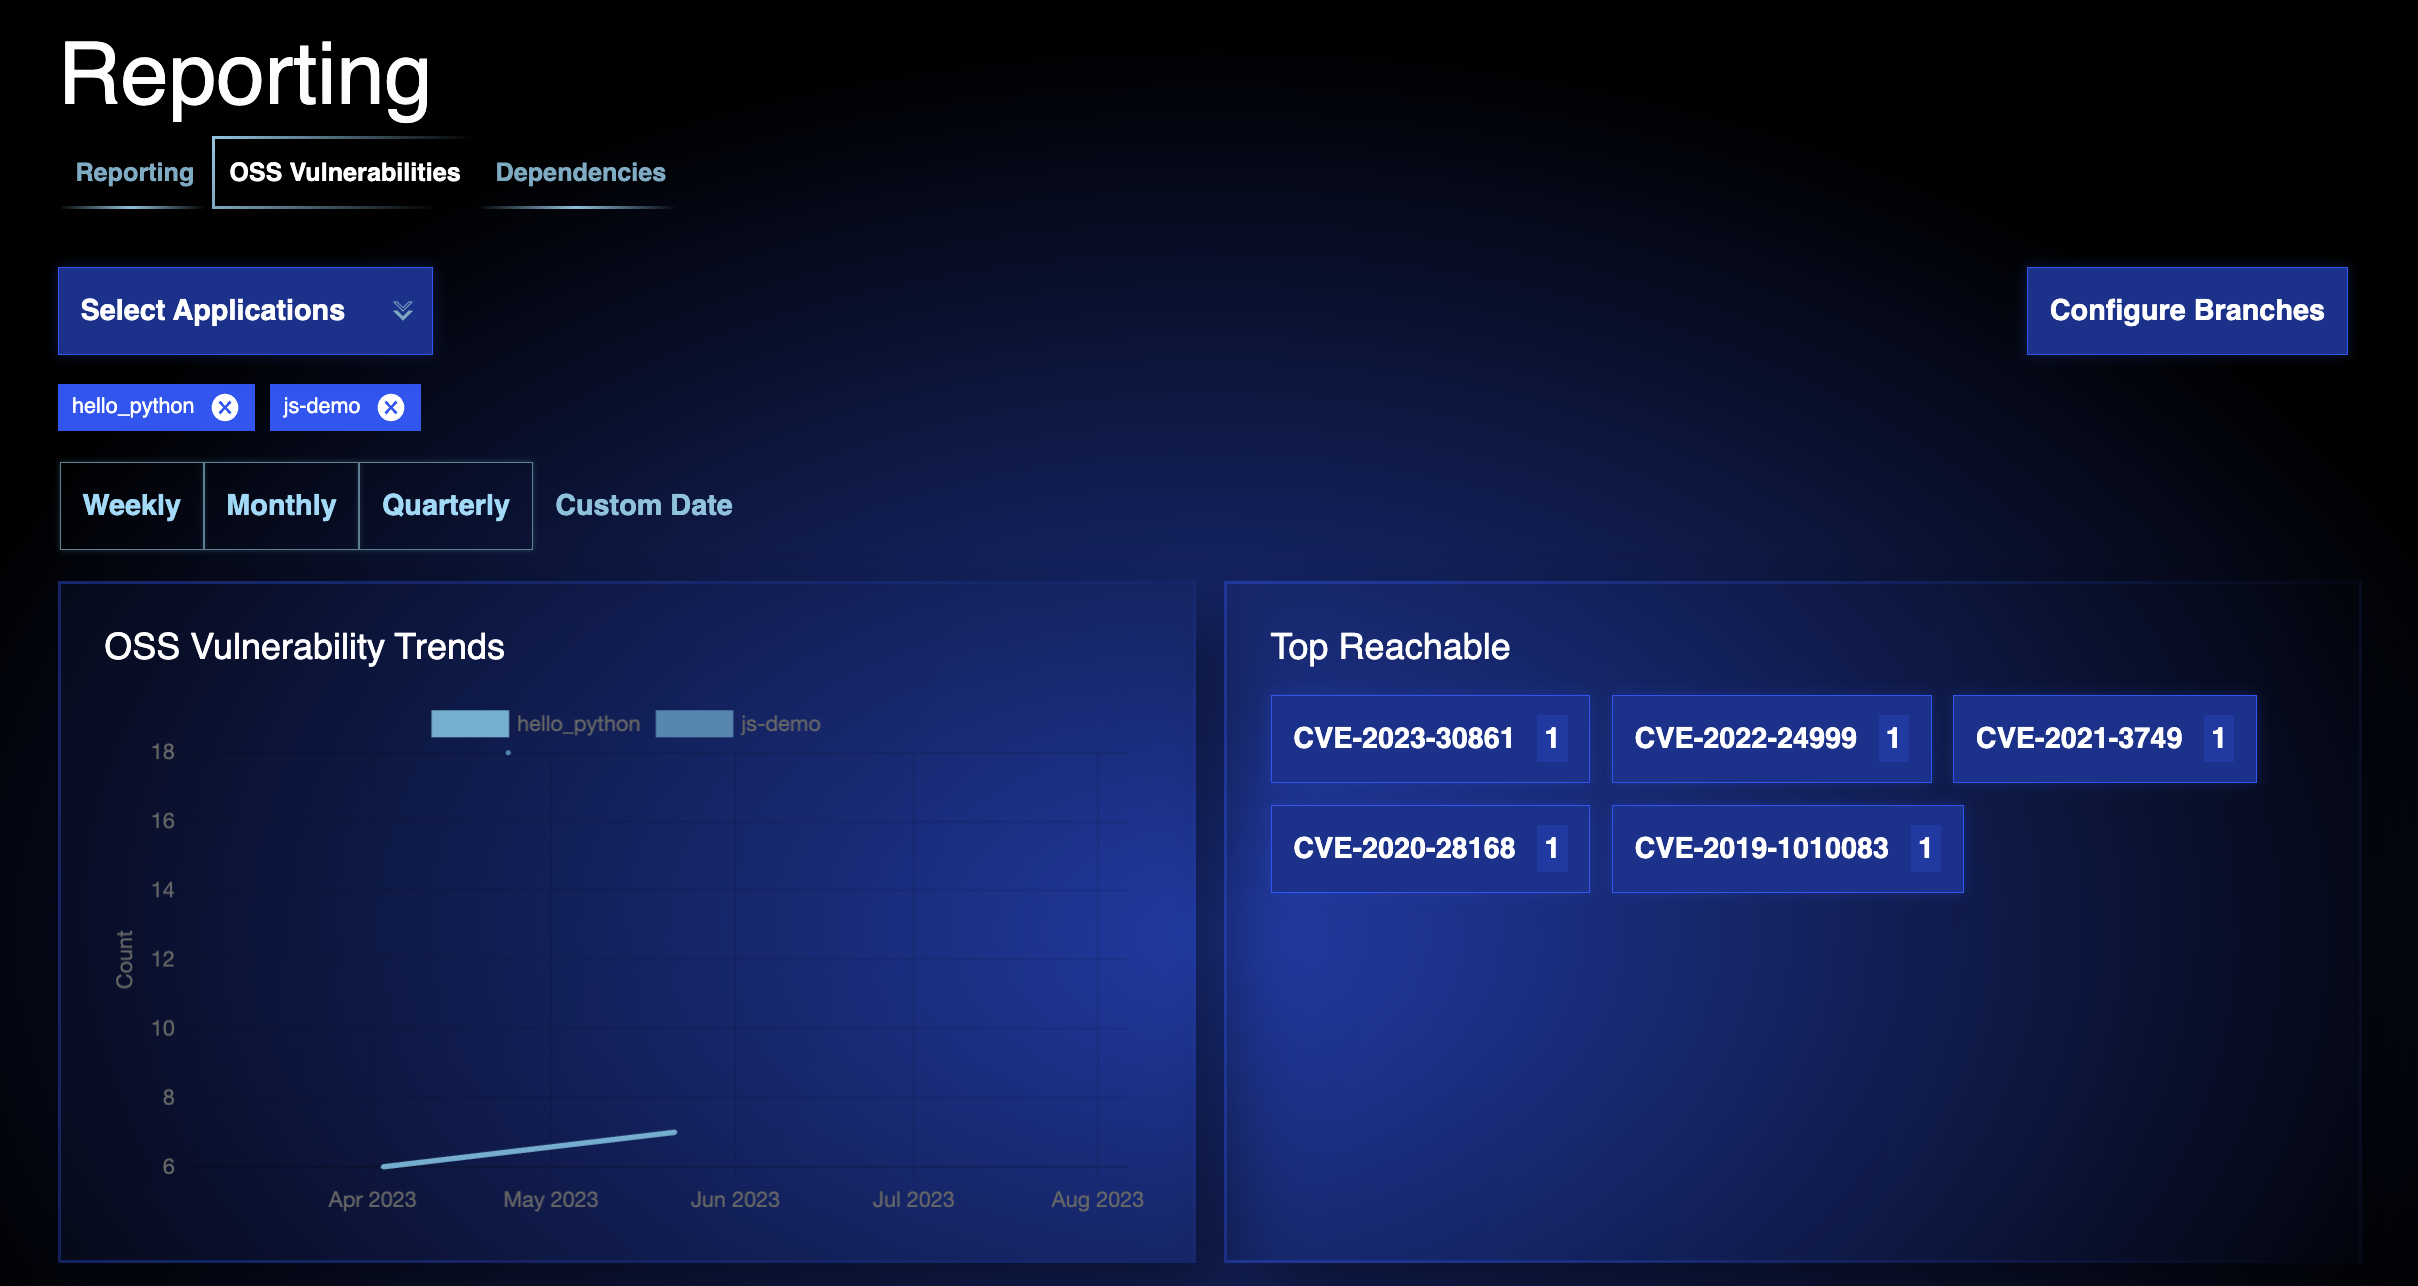
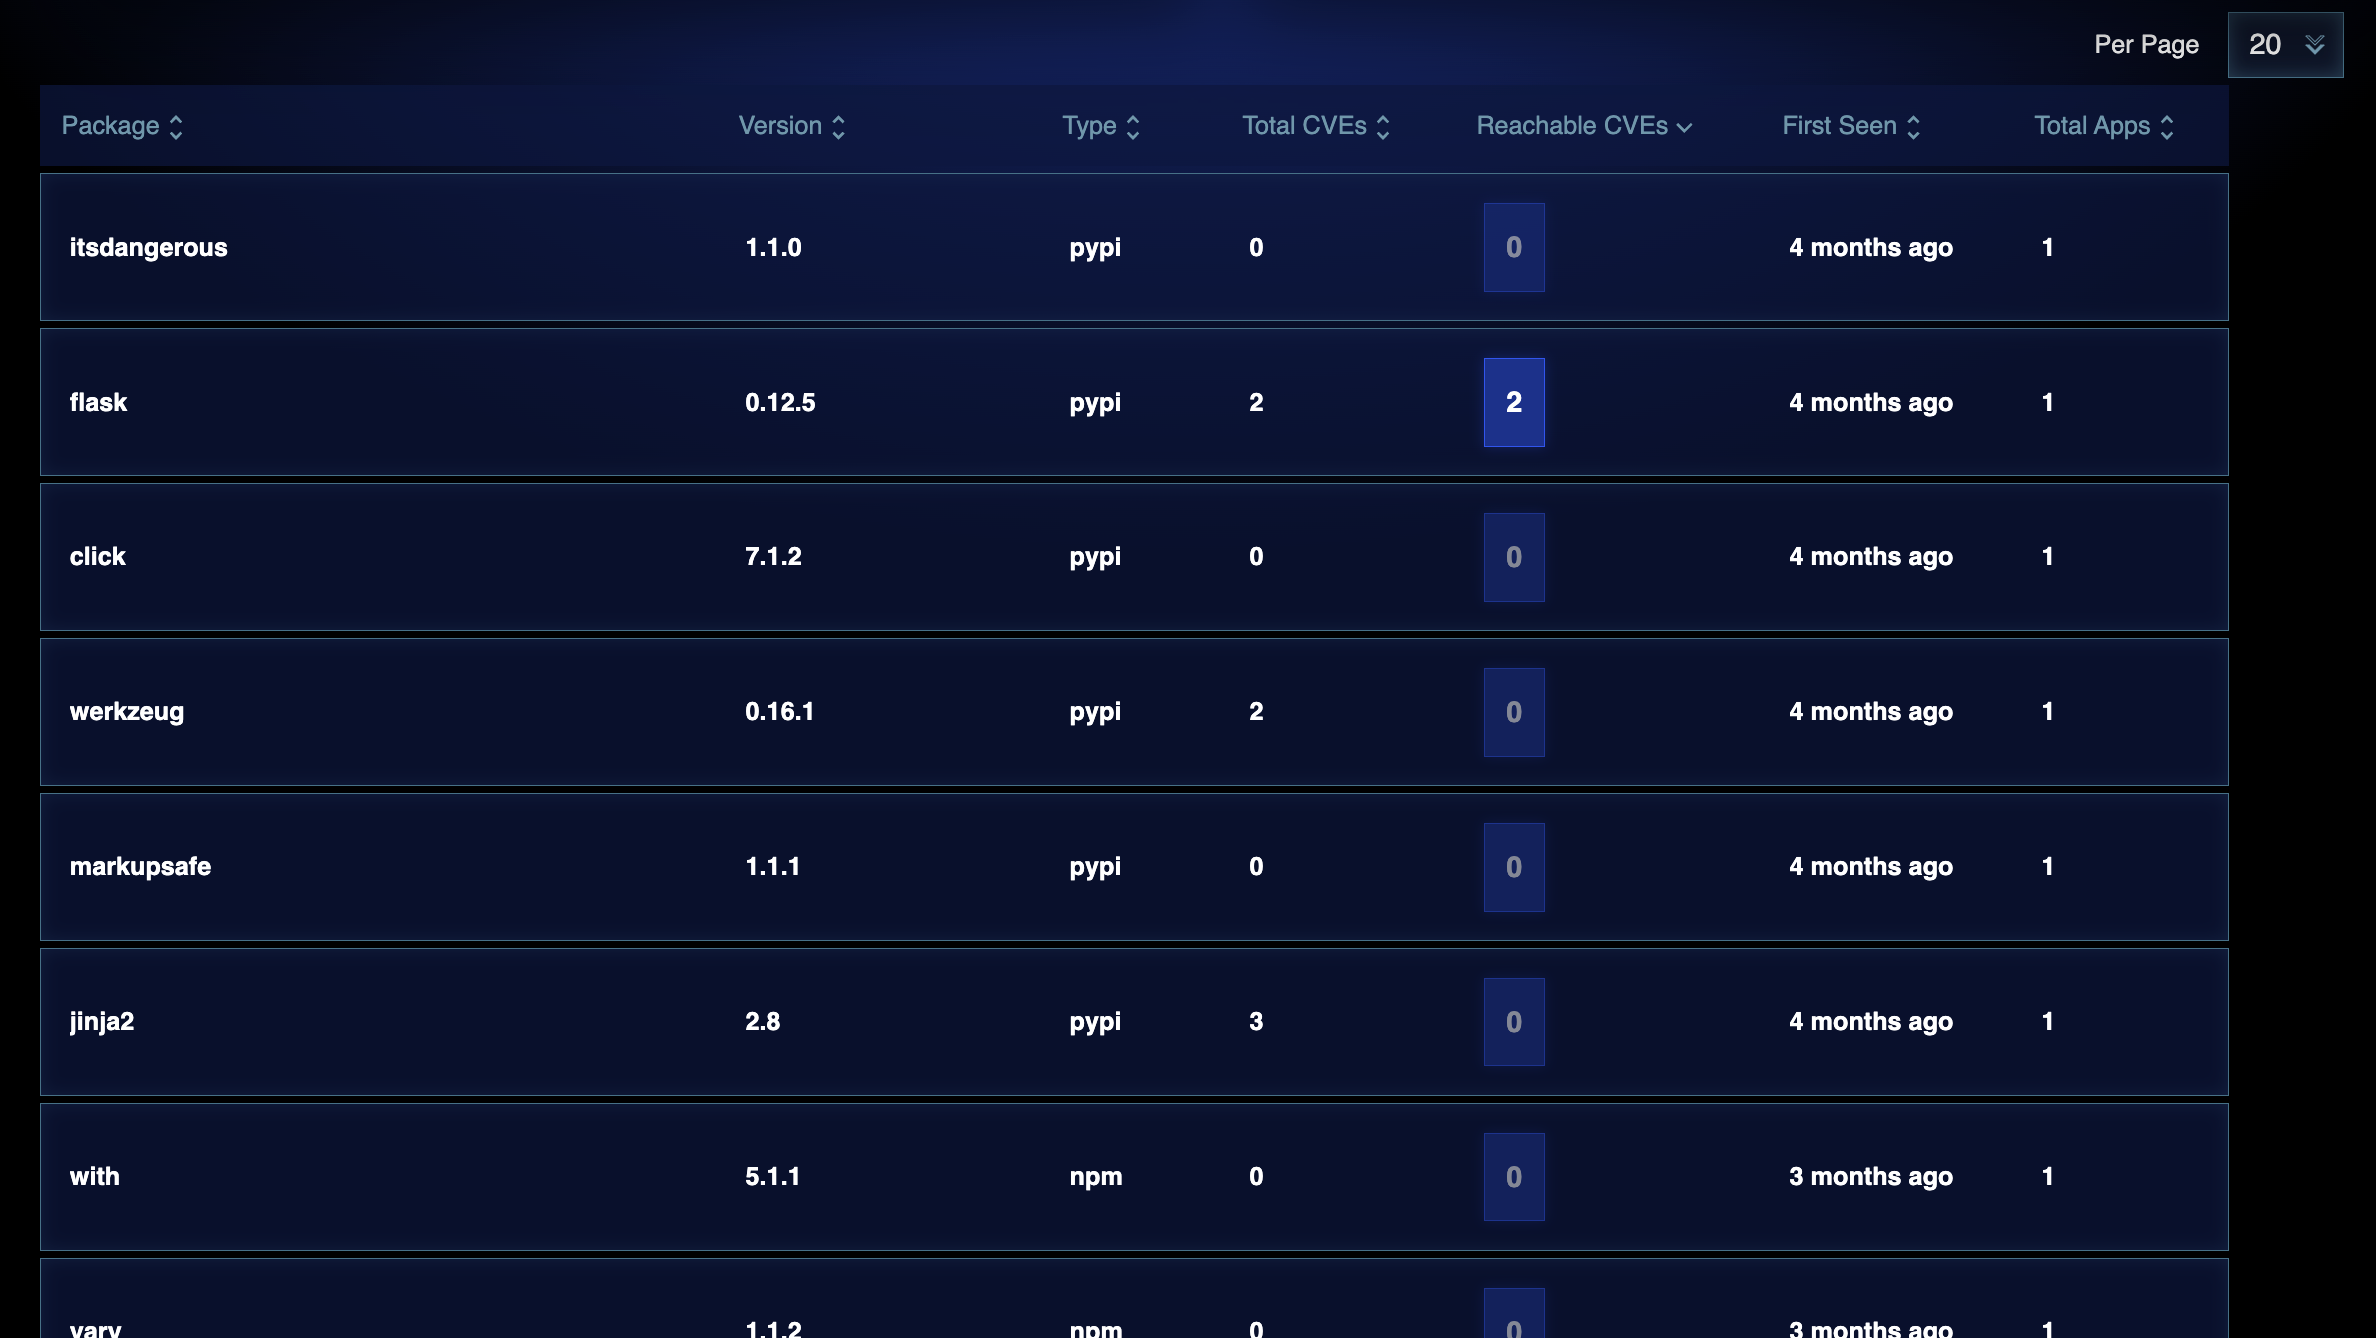
Underneath the summary information is a full list of packages that introduce vulnerabilities, as well as:
- Its version number
- Its type
- The total number of CVEs associated with that package
- The number of reachable CVEs
- When findings related to that package were first identified
- The number of applications affected
Configuring branches when viewing OSS vulnerabilities
You can include only specific branches rather than all the data for a given application. For example, let's say that your report includes information for App A and App B. However, you can customize the report to include information for all branches scanned for App A. For App B, you could include only two branches: fix-1 and fix-2.
To do so, click Configure Branches in the top-right.
Dependencies
The reporting section features a Dependencies tab, which lists the libraries, packages, and external tooling used by your org's apps.
In addition to showing the specific apps and the dependencies on which they rely, Qwiet's list also displays a CVE ID to help you find additional information about issues resulting from using a particular dependency.
The provided search filter allows you to look for apps with specific dependencies or patterns (e.g., log4j).